PureCars insights
See Your Market Clearly.
Make Smarter Marketing Decisions
PureCars Insights brings your dealership's performance and your local market together in one view, so every marketing decision is backed by context, not guesswork.



More Data Hasn't Made the Decisions Easier
Most dealers already have plenty of data. Marketing dashboards, DMS reports, ad platform metrics, third-party market data. What's missing isn't more of it. It's the context to know what any of it means.
Where should we spend more?
Where are we losing market share?
Which models should we be promoting right now?
Where is demand actually increasing?
Where are our biggest geographic opportunities?
How do we stack up against the dealer down the road?
Is our marketing lining up with how people in our market are actually buying?
Those are the questions dealers are trying to answer every month, often with reports that weren't built to answer them.

Dealership Performance, Meet Market Context
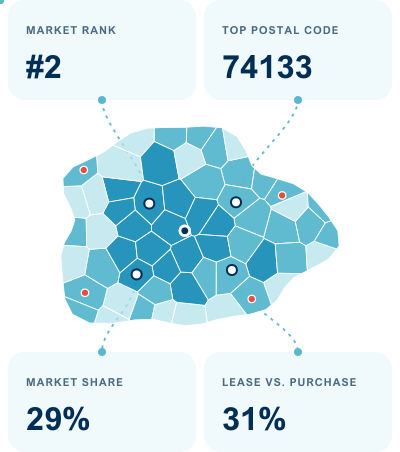
PureCars Insights brings your marketing performance and your local market intelligence into a single view, so you can see not just what your dealership is doing, but what's happening around it.
That means understanding:
Marketing performance
How your campaigns are actually performing.
Market demand
Where demand is rising or falling in your area.
Competitive position
How you compare to nearby dealers.
Model trends
Which models are gaining or losing traction.
Geographic opportunities
Where the growth is, block by block.
Lease vs. purchase behavior
How local buyers prefer to transact.
Media mix performance
Where your budget is working, and where it isn't.
More data was never the goal. Clarity is. PureCars Insights is built to give dealers that clarity, so the next decision is an informed one instead of a guess.



Reports Built Around Dealer Questions, Not Just Metrics
Every Insights report is organized around a question dealers are already asking, and built to answer it clearly enough to act on.
Each report tells you what's happening, what it means for your dealership, and what to do next.

Marketing Performance, in Context
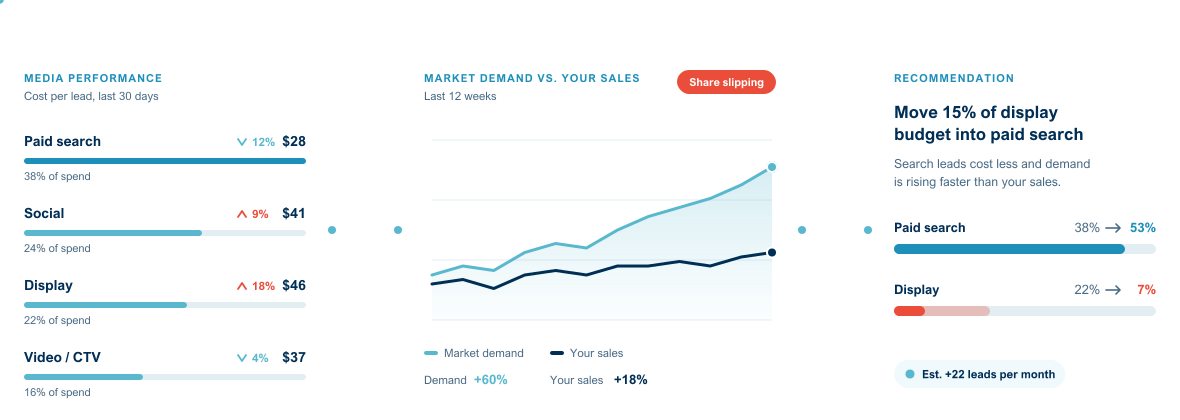
PureCars Insights connects your media performance to what's actually happening in your market, so you're never evaluating a campaign in isolation. See how each channel is performing, where there's an opportunity to shift budget, and how your marketing decisions hold up against real market conditions, not just last month's numbers.


One View, Every Rooftop
For dealer groups, PureCars Insights rolls performance and market intelligence up across every location into a single, consistent view.
Roll-up reporting
Across the entire group.
Rooftop comparisons
To see what's working where.
Market trends
Specific to each location.
Consistent reporting
So every rooftop is measured the same way.
Leadership visibility
Into performance across the group.
Team alignment
Around the same data and the same priorities.
Frequently Asked Questions
Have questions about understanding your market performance? We've answered the most common ones here. For more information, visit our FAQ page.
What is PureCars Insights?
PureCars Insights brings your dealership’s performance and local market intelligence into one view. It helps you understand what’s happening in your market, how your dealership compares, and where there may be opportunities to adjust your marketing strategy.
What can I see in PureCars Insights?
PureCars Insights includes reports covering market trends, competitive position, model demand, geographic opportunities, lease versus purchase behavior, and marketing performance. Together, these reports provide a broader view of what’s happening in your market and how your dealership is performing within it.
How does PureCars Insights help with marketing decisions?
Instead of evaluating marketing performance on its own, PureCars Insights puts your results in the context of what’s happening in your local market. This can help you identify where to shift budget, adjust targeting, refine messaging, or focus your marketing efforts.
Can PureCars Insights help me understand my competition?
Yes. The Market Rank report provides visibility into your competitive position and market share, helping you see how your dealership compares with nearby dealers and how the competitive landscape is changing.
Can dealer groups use PureCars Insights across multiple rooftops?
Yes. Dealer groups can view performance and market intelligence across multiple locations, compare rooftops, and see market trends specific to each location. This gives leadership and individual teams a consistent view of performance and priorities across the group.

From Insight to Action
1
See
Understand what's happening in your market.
2
Understand
Put your dealership's performance into that context.
3
Act
Adjust budgets, targeting, messaging, and strategy based on what the data actually shows.