.svg)
Back to School: Grading Your Inventory Performance with Pure Insights
As the back-to-school season kicks in, dealerships have an opportunity to sharpen their focus, get organized, and make smarter decisions. But instead of textbooks and report cards, your dealership’s success comes down to inventory, demand, and shopper behavior.
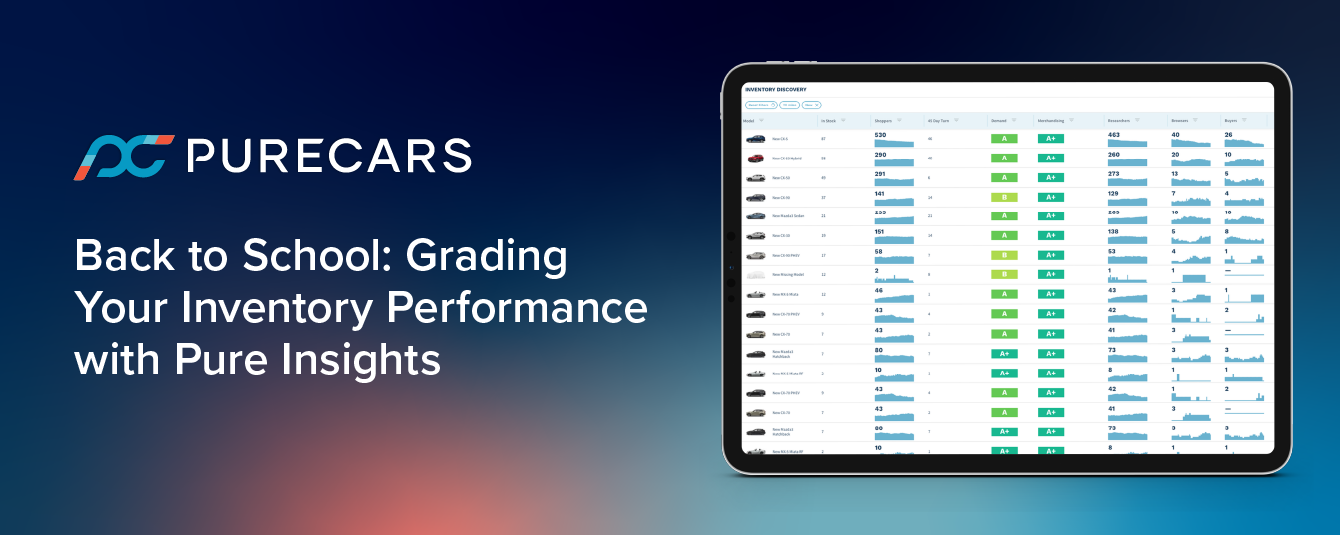
Inside PureCars reporting, the Inventory Report in Pure Insights gives your dealership a report card of its own—grading performance at the model level so you can quickly see what’s passing, what’s failing, and where to improve.
Your Inventory, At a Glance
Think of this as your classroom roster. The Inventory Report shows exactly how many units you have in stock right now, giving you a real-time snapshot of what’s on your lot. This isn’t an average or a trend—it’s the current state of your inventory, so you can make decisions based on what’s actually available to sell today.
Demand & Merchandising: Your Dealership’s Report Card
Here’s where things get interesting.
Two of the most powerful columns in the report—Demand and Merchandising—are graded from A+ to F-, making it easy to quickly understand performance without digging into complex data.
- Demand Grade
Measures how much shopper interest and engagement a specific model is receiving.- A+ = High demand, strong shopper activity
- F- = Little to no interest
- Merchandising Grade
Evaluates how well your inventory is presented online.- Are there photos?
- Is pricing included?
- Is the listing complete?
- A+ = Fully optimized listings
- F- = Missing key details that can hurt conversions
With this grading system, you don’t need to interpret complicated analytics—you can instantly see which models are excelling and which need attention.
Who’s Showing Up to Class? Shopper Engagement by Model
The report also shows how many shoppers are viewing each model over a selected time period.
Instead of guessing what’s popular, you can clearly see where interest is building—and where it’s not. This helps you align your inventory and marketing strategy with actual shopper behavior.
From Curious to Committed: The Shopper Funnel
Just like students progress through a school year, shoppers move through stages before making a purchase:
- Researchers – Browsing broadly, early in their journey
- Browsers – Narrowing down options, comparing models
- Buyers – High-intent shoppers, likely to convert soon
This breakdown helps you understand not just how many shoppers you have—but how close they are to making a decision.
Sales Velocity: How Fast Are You Moving Inventory?
The report also tracks how quickly vehicles are selling, such as a 45-day turn.
This helps answer key questions:
- Are certain models moving quickly?
- Are others sitting too long?
It’s a simple way to spot overstocked models or high-performing inventory that may need to be replenished.
Study Hall: Turning Grades Into Action
The real value of the Inventory Report is how quickly it helps you take action.
- A+ Demand, Low Inventory
→ Time to stock up - High Inventory, Low Grades
→ Improve merchandising or adjust strategy - Strong Demand, Weak Merchandising
→ Easy win—optimize listings to capture more conversions
Instead of spending hours piecing together reports, you get clear direction in seconds.
No More Guesswork, No More Confusion
Dealers often rely on tools that are difficult to interpret and don’t provide model-level insights.
The Inventory Report changes that by bringing everything together:
- Inventory levels
- Shopper engagement
- Sales performance
- Merchandising quality
All in one place, in a format that’s easy to understand.
Make the Grade This Season
Back-to-school is all about preparation and performance—and your dealership should be no different.
With the Inventory Report inside Pure Insights, you get a clear, simple way to evaluate what’s working, what’s not, and where to focus next.
Because when you can see your inventory performance as clearly as a report card, it’s a whole lot easier to improve your grade.

Book a meeting with us


Back to School: Grading Your Inventory Performance with Pure Insights
As the back-to-school season kicks in, dealerships have an opportunity to sharpen their focus, get organized, and make smarter decisions. But instead of textbooks and report cards, your dealership’s success comes down to inventory, demand, and shopper behavior.
Inside PureCars reporting, the Inventory Report in Pure Insights gives your dealership a report card of its own—grading performance at the model level so you can quickly see what’s passing, what’s failing, and where to improve.
Your Inventory, At a Glance
Think of this as your classroom roster. The Inventory Report shows exactly how many units you have in stock right now, giving you a real-time snapshot of what’s on your lot. This isn’t an average or a trend—it’s the current state of your inventory, so you can make decisions based on what’s actually available to sell today.
Demand & Merchandising: Your Dealership’s Report Card
Here’s where things get interesting.
Two of the most powerful columns in the report—Demand and Merchandising—are graded from A+ to F-, making it easy to quickly understand performance without digging into complex data.
- Demand Grade
Measures how much shopper interest and engagement a specific model is receiving.- A+ = High demand, strong shopper activity
- F- = Little to no interest
- Merchandising Grade
Evaluates how well your inventory is presented online.- Are there photos?
- Is pricing included?
- Is the listing complete?
- A+ = Fully optimized listings
- F- = Missing key details that can hurt conversions
With this grading system, you don’t need to interpret complicated analytics—you can instantly see which models are excelling and which need attention.
Who’s Showing Up to Class? Shopper Engagement by Model
The report also shows how many shoppers are viewing each model over a selected time period.
Instead of guessing what’s popular, you can clearly see where interest is building—and where it’s not. This helps you align your inventory and marketing strategy with actual shopper behavior.
From Curious to Committed: The Shopper Funnel
Just like students progress through a school year, shoppers move through stages before making a purchase:
- Researchers – Browsing broadly, early in their journey
- Browsers – Narrowing down options, comparing models
- Buyers – High-intent shoppers, likely to convert soon
This breakdown helps you understand not just how many shoppers you have—but how close they are to making a decision.
Sales Velocity: How Fast Are You Moving Inventory?
The report also tracks how quickly vehicles are selling, such as a 45-day turn.
This helps answer key questions:
- Are certain models moving quickly?
- Are others sitting too long?
It’s a simple way to spot overstocked models or high-performing inventory that may need to be replenished.
Study Hall: Turning Grades Into Action
The real value of the Inventory Report is how quickly it helps you take action.
- A+ Demand, Low Inventory
→ Time to stock up - High Inventory, Low Grades
→ Improve merchandising or adjust strategy - Strong Demand, Weak Merchandising
→ Easy win—optimize listings to capture more conversions
Instead of spending hours piecing together reports, you get clear direction in seconds.
No More Guesswork, No More Confusion
Dealers often rely on tools that are difficult to interpret and don’t provide model-level insights.
The Inventory Report changes that by bringing everything together:
- Inventory levels
- Shopper engagement
- Sales performance
- Merchandising quality
All in one place, in a format that’s easy to understand.
Make the Grade This Season
Back-to-school is all about preparation and performance—and your dealership should be no different.
With the Inventory Report inside Pure Insights, you get a clear, simple way to evaluate what’s working, what’s not, and where to focus next.
Because when you can see your inventory performance as clearly as a report card, it’s a whole lot easier to improve your grade.

Book a meeting with us
More stories

.png)
Stay Connected
Subscribe for PureCars updates.

